
Tariffs Drive Market Volatility
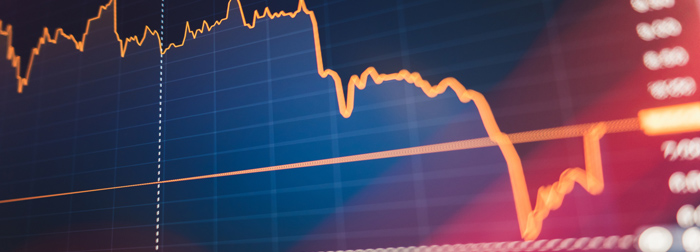
On April 2, 2025, President Trump announced sweeping tariffs on imported goods that were significantly larger and different in structure than expected. Over the next two days, the S&P 500 Index plunged by 10.5%. The Dow Jones Industrial Average lost 9.3%, and the tech-heavy NASDAQ Index dropped 11.4%.1 The two-day rout erased $6.6 trillion in market value, the largest two-day loss of shareholder value in U.S. history.2
The bond market reaction was slower but even more concerning. On April 9 — the day the new tariffs became effective — yields on the two-year U.S. Treasury note rose by more than 0.3 percentage points in intraday trading, a huge move by the standards of normally stable Treasuries, and the largest increase since 2009. Yields move inversely with prices, so the rapid increase in yield suggested that investors were selling their Treasuries at lower prices, possibly out of fear that China and other foreign investors would sell their large holdings. Treasury securities form the bedrock of the U.S. financial system, and higher yields could cost the federal government billions of dollars more in interest.3
While the Trump administration shrugged off the stock market volatility, it could not ignore the disturbance in the Treasury market, and the president announced a 90-day pause on most of the new tariffs. This calmed the Treasury market and sent stocks soaring, with the S&P 500 gaining 9.5% on April 9, the largest one-day gain since 2008.4
Since that bounceback, the market has continued to be volatile, with big swings during trading hours and from day to day. Although it’s natural to be concerned about market volatility, it’s important not to overreact and to maintain a steady eye on long-term goals. It may be helpful to consider the causes of the volatility along with a longer-term view of market trends.
A surprising approach
There is an adage that the market does not like surprises, and the tariffs announced on April 2 caught investors by surprise. Whereas the expected reciprocal tariffs would match those set by other countries on U.S. goods, the new tariffs used an untested calculation based on the trade deficit in goods between the United States and a given country. Trade in services, in which the United States often has a surplus, was not considered. Most economists believe that trade deficits are not necessarily bad or the result of unfair trading practices, and the calculation resulted in unexpectedly high new tariffs.
Nearly all countries, including those that buy more U.S. goods than they sell, were assessed a minimum 10% tariff. The European Union, which provides almost one-fifth of U.S. imports, was assessed a 20% tariff. Other important sources of imports with high new tariffs included Vietnam (46%), Taiwan (32%), India (27%), South Korea (26%), and Japan (24%).5
The 90-day pause allowed more time for negotiation, and Treasury Secretary Scott Bessent indicated that more than 75 countries have contacted the administration. However, the pause did not apply to the 10% minimum tariff, or tariffs on steel, aluminum, cars, and many goods from Mexico and Canada. Nor did it apply to China, which has matched U.S. tariffs tit for tat.6 As of mid-April, the average U.S. tariff on Chinese goods was 124.1%, while the average Chinese tariff on U.S. goods was 147.6%.7
The situation with China is fraught with peril for both sides, and the general tariff program — whatever form it takes — could increase consumer prices to a level that seriously slows consumer spending, the driving force of the U.S. economic engine. The Trump administration’s stated goals are to stimulate U.S. manufacturing, address unfairness in international trade, and increase U.S. revenue. While these are laudable goals, the questions are whether the tariffs will achieve those goals and, if so, how much economic pain will they cause along the way?
Investing for the long term
Although it is impossible to predict the market, you can probably expect volatility for some time. While any substantial decline can be worrisome, it’s important to remember that markets are cyclical and historically have always bounced back. Here are some other considerations that may help provide perspective.
After a down year in 2022, the S&P 500 gained 24.23% in 2023 and 23.31% in 2024, the largest two-year increase since 1998.8–9 Although 2025 has been rocky, the index set an all-time record on February 19, 2025, after the initial round of tariffs was announced.10 So the current market turmoil is coming after a period of unusual strength. While it may be disturbing to watch the value of your investments decline, the current drop is from a high level, and the current value of your portfolio might be similar to what it was at a time when the value seemed satisfying.
The losses you see in your investment account are only paper losses until you sell. Panic selling locks in those losses. Historically, some of the best days of stock market performance have followed some of the worst days. Pulling out of the market due to an emotional reaction can lead to missing gains on the way back up.
Since 1928, the S&P 500 Index has returned an annual average of about 10%.11 Annual returns have varied widely, but, on average, bull markets have lasted over three times longer than bear markets and gained over three times more than bear markets have lost.12 Past performance does not guarantee future results, but the clear message of these statistics is that it generally pays to be patient and stick to your long-term strategy.
All investing involves risk, including the possible loss of principal. U.S. Treasury securities are guaranteed by the federal government as to the timely payment of principal and interest. The principal value of Treasury securities fluctuates with market conditions. If not held to maturity, they could be worth more or less than the original amount paid. The S&P 500 Index is an unmanaged group of securities considered representative of the U.S. stock market in general. The performance of an unmanaged index is not indicative of the performance of any specific investment. Individuals cannot invest directly in an index. Actual results will vary.